Today we want to offer our readers a slightly different analysis from the usual ones, but always referring to the Olympics.
We wanted to correlate race walking technique expressed in terms of Country with the number of medals won, but above all with the number of athletes in the top eight.
To do this, we took into consideration the number of red cards received by a single country as follows:
a) London 2012 Olympic Games
b) Rio de Janeiro Olympic Games 2016
c) We then calculated the average between a) and b)
d) Tokyo 2020 Olympic Games
e) We finally calculated the difference
For the moment we have limited ourselves to carrying out this analysis by aggregating the two men's races of the 20km and the 50km. In the next few days we will do the same for the 20km women.
In table no. 1 below our readers will find the results.

Very interesting are the total number of red cards issued by the three juries (which we recall were very homogeneous with only a few small changes over the years).
Against 74 red cards (30 for bent knee and 44 for contact) from London to Rio de Janeiro as many as 122 had been issued (44 for bent knee and 78 for contact). The average value of the two previous editions of the Olympic Games was therefore 98 total red cards (37 for bent knee and 61 for contact).
Tokyo recorded a significant improvement: there were only 88 red cards, but while the number of those relating to bent knee remained the same (37), that of loss of contact phase decreased by 10 units (51).
It is also very interesting to note that 25 countries (those with the - sign) out of 42 that received at least one red card with their athletes recorded an improvement in Tokyo (in some cases only marginal). Among these, the best leap in quality was made by Chile, but above all by Poland whose athletes in Rio de Janeiro had been particularly sanctioned, while in Tokyo they received globally only a red card, among other things, also winning a heavy medal. gold in the 50km.
On the other hand, the worsening of the technical situations in Latvia stand out negatively, but even more so in Guatemala.
Guatemala in London had received 8 red cards, but at least had won a medal, now in Tokyo they have received 15 (bringing the difference with the previous average from 6.5 to a dramatic 8.5), obtaining in exchange, as best result of his athletes, only a 30th place in the 20km men.
Finally, there were two the Countries that have neither improved nor worsened compared to the average: Norway and Italy.
However, it must be said that, compared to Rio de Janeiro, where Italy obtained 8th place in the 20km, here in Tokyo it has obtained gold in the 20km. In both cases the two athletes finished the race with a red card.
In table no. 2 below our readers will find the evolution of the medals and the number of athletes classified in the top eight (what in jargon are called "Olympic diplomas").
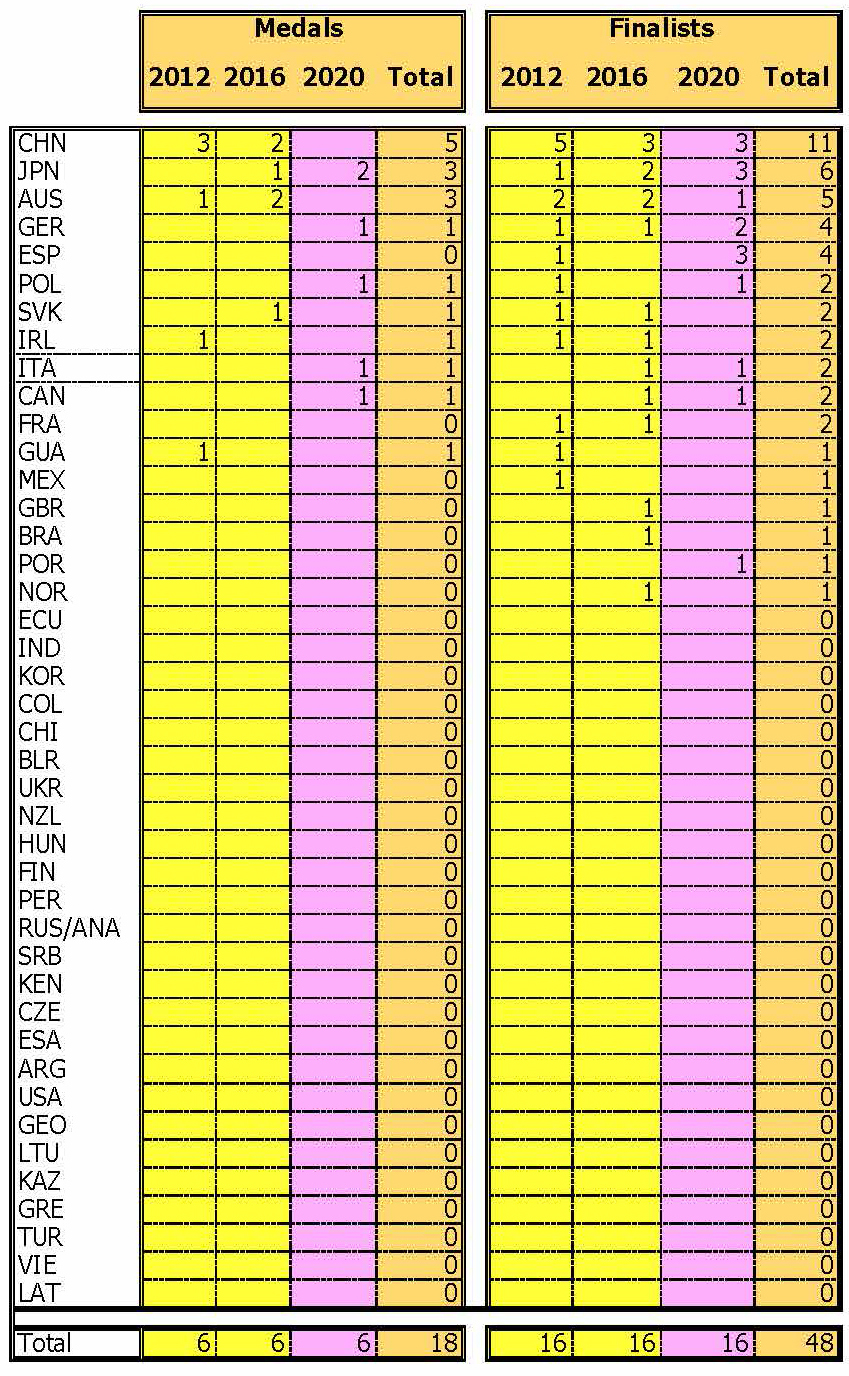
Leading Countries in men are always the same (China, Japan, Australia, Canada, Spain, Germany, and Italy).
However, it seems very clear that in Tokyo 2020, China, Australia did not collect medals is certainly due to a high generational change (China has lost over the years: Chen Ding, Wang Zhen and Si Tianfeng while for Australia Jared Tallent did not participate.
To this must be added the progress of the years which weighed on two athletes (Cai Zelin, CHN and Matej Toth, SVK) who had won silver and gold in Rio.
On the other hand, we have seen Japan's great leap in quality with two medals and three athletes in the top eight, even if frankly, the prospects of the last two seasons showed Japan as the opponent to beat. Someone (and we among them) also hypothesized for Japan at least four medals in men.
The suspense of the 50km gave the medals to Poland (it was not since the time of the great Robert Korzeniowski), Canada and Germany
Then there is gold for Italy in the 20km.
It does not win medals, but Spain gets three athletes in the top eight, match up to China and Japan: that is to say that the good school does not lie.
Finally, in our opinion, probably the most interesting parameter to analyze is that of the correlation between the best eight athletes compared to the consolidated economic data of each country, using as an observation the positioning of the main Countries indicated above with respect to the Gross Domestic Product which is given by the following equation:
GDP = consumption + government spending + investments + net exports
| Country | GDP in $ (billion x 1000) | Athletes in first eight | Athlete % |
| Spain | $ 1.350 | 3 | 450 |
| Poland | $ 643 | 1 | 643 |
| Australia | $ 1.480 | 1 | 1.480 |
| Canada | $ 1.643 | 1 | 1.643 |
| Japan | $ 5.064 | 3 | 1.688 |
| Italy | $ 1.886 | 1 | 1.886 |
| Germany | $ 3.806 | 2 | 1.903 |
| China | $ 14.722 | 3 | 4.907 |
If we look at it from this point of view, Spain and Poland are the Countries that expressed themselves best in Tokyo 2020.