As already done for men, today we offer our readers the same analysis referring to the women's Olympic Games in which we have correlated the race walking technique expressed in terms of Country with the number of medals won, but above all with the number of athletes in the first eight.
To do this, we took into consideration the number of red cards received by a single country as follows:
a) London 2012 Olympic Games
b) Rio de Janeiro Olympic Games 2016
c) We then calculated the average between a) and b)
d) Tokyo 2020 Olympic Games
e) We finally calculated the difference
In table n. 1 below our readers will find the results.
Very interesting are the total number of red cards issued by the individual juries (which we recall were very homogeneous with only a few small variations over the years).
Against 25 red cards (3 for ben knee and 22 for loss of contact) from London to Rio de Janeiro as many as 52 had been issued (4 for bent knee and 44 for loss of contact). The average value of the two previous editions of the Olympic Games was therefore 44 total red cards (5.5 for bent knee and 33 for loss of contact).
First of all, it is immediately obvious that in the women's Olympic Games the technical error related to bent knee represents a minimal percentage (8% in London, 15% in Rio; 11% in Tokyo): on average 13%.
We imagine, but we are not sure, that this is due to the greater ease that women have, compared to men, in the movement of the hips which we remember being the main "engine" for a correct extension of the knee.
Compared to the average of the two previous Olympic Games, Tokyo did not present a variation that aroused any statistical interest: the red cards were 47 (4 less than Rio), and also the number of those relating to bent knee (5) and that of flight phase (39) decreased slightly.
It is also interesting to note that out of 18 Nations that have received at least one red card with their athletes and excluding those that were not present in previous editions, most have registered an improvement. However, the improvement was completely marginal if we exclude Korea (not present in Tokyo) and Ethiopia, whose only participant was already stopped after a third of the race
However, it seems interesting to us to say a few words about China, Spain, and Italy. The first two recorded a worsening compared to the two present editions, while Italy a slight improvement. All three of these Nations, however, share the fact that the number of red cards against their athletes are to be correlated to a single athlete.
This same reasoning applies to Colombia, Russia, Greece, Peru, Ecuador and especially Brazil.
While the technical situation of Guatemala is a little different. It is true that compared to the average of the two previous editions there has been a slight improvement, but it is equally true that if we look at the editions of the Olympic Games in a separate way we will see that the technical error of loss of contact in the athletes of Guatemala unfortunately it is always present, as we have also noted it in the analysis we have done for men.
In table no. 2 below our readers will find the evolution of the medals and the number of athletes classified in the top eight (what in jargon are called "Olympic diplomas").
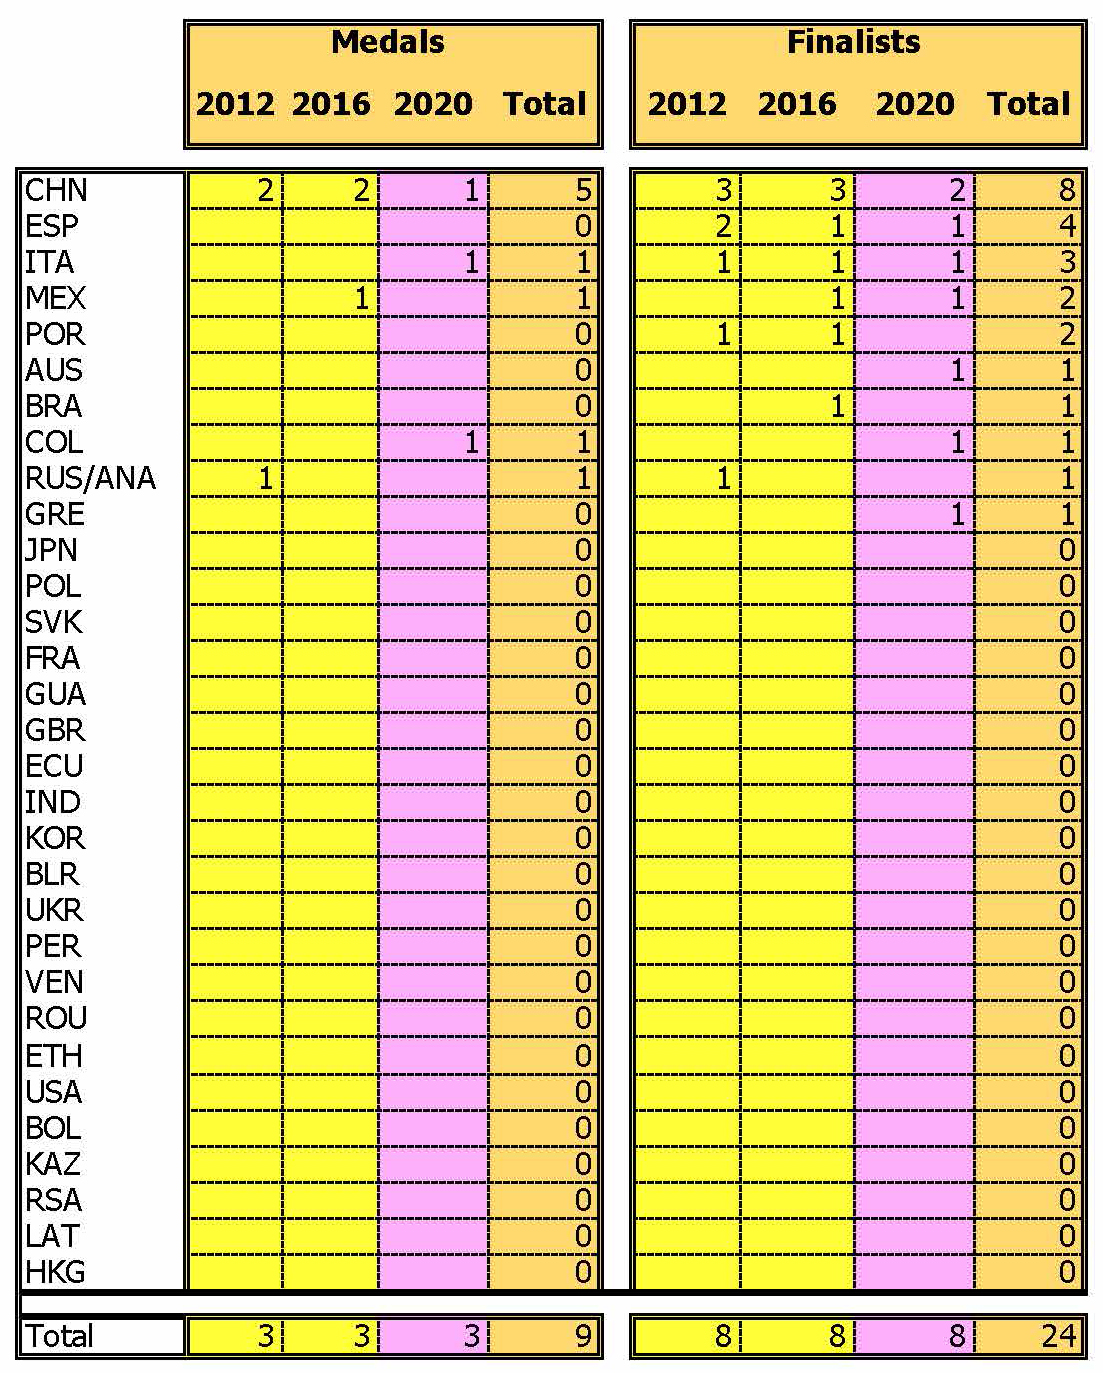
Even in women, leading Countries in women are always the same (China, Spain, Mexico and Italy).
In recent years, they have been joined by Colombia and Brazil.
We cannot comment on Russia as after London 2012 it experienced a very special situation.
However, it seems very clear that in Tokyo 2020, China did not collect the expected medals.
In the last three editions of the Olympic Games there have always been two athletes who have participated in all three editions to represent China, while in the last one the selection made past March in Huangshan brought a new name to the fore.
Precisely this new name (after all who already raced in Doha 2019 World Championships) was the one that presented the greatest technical problems, just like in Doha.
Of the other two athletes, one probably suffered much more than the others the speed change made at three quarters of the race, while the last one still got an honorable bronze.
You can't always win in sports; the norm is an alternation between wins and losses.
On the other hand, we have witnessed the great leap in quality of Italy, winning both in men and women, but beautiful pages have already been written in all the sports newspapers of the world in the Olympic history of Tokyo in the Bel Paese.
Finally, let's continue with what is probably the most interesting parameter to analyze: the correlation between the best eight athletes compared to the consolidated economic data of each Country, using as an observation the positioning of the main countries indicated above with respect to the Gross Domestic Product which is given by the following equation:
GDP = consumption + government spending + investments + net exports
| Country | GDP in $ (billion x 1000) | Athletes in first eight | Athlete % |
| Greece | $ 231 | 1 | 231 |
| Colombia | $ 353 | 1 | 353 |
| Mexico | $ 1.320 | 1 | 1.320 |
| Spain | $ 1.350 | 1 | 1.350 |
| Australia | $ 1.480 | 1 | 1.480 |
| Italy | $ 1.886 | 1 | 1.886 |
| China | $ 14.722 | 2 | 7.361 |
It seems strange, but even in women, the less rich Countries are the ones that get a more interesting ratio per athlete.