The last chart that we propose our readers is that of 20km men.
We summarize data selection standard.
- We have first of all chosen the best ten performances in the world as they appear from the official lists of the IAAF
- We have limited our choice to the last five years, starting from 2014 up to and including 2018
- The average speed of these ten best performances in the world is the reference mark for every single year
- We then analyzed the ten best performances for each Area, obtaining the relative average speed for each Area. The difference in terms of km/hr between that obtained by analyzing the data of the first ten athletes in the world and those of the top ten athletes in each area is what we have called "negative spread".
Some considerations
- The graph curves of the average speed measured at world level and those of the graphs of the same speed detected at the Asia level are very similar over the years.
The trend of the curve is almost overlapping The only differences are given by small differences in values in terms of speed and negative spread.
This means that the curve of the average of the top ten world speeds in the men's 20km is increasingly dependent on the geographic area of Asia.
Let's see it in terms of negative spread values
| 20km men - average speed | 2014 | 2015 | 2016 | 2017 | 2018 |
| | | | | | |
| World average speed | 15,17 | 15,26 | 15,17 | 15,25 | 15,28 |
| Asia average speed | 15,06 | 15,24 | 15,12 | 15,18 | 15,20 |
| Negative Spread: Asia-World | -0,11 | -0,02 | -0,05 | -0,07 | -0,08 |
The Europe that in 2016 had an average speed in the 20km men of 0,02 km/hr higher (15,08 against 15,06) than that of Asia progressively decreased in the following years with consequent negative spread higher
| 20km men - average speed | 2014 | 2015 | 2016 | 2017 | 2018 |
| | | | | | |
| World average speed | 15,17 | 15,26 | 15,17 | 15,25 | 15,28 |
| Europe average speed | 15,08 | 15,02 | 14,98 | 15,02 | 15,04 |
| Negative Spread: Europe-World | -0,09 | -0,24 | -0,19 | -0,23 | -0,24 |
The most impressive figure, however, can be seen in the following table that indicates the number of athletes contributing to form the basic average world speed on the 20km men (that is how many athletes of single Area in the top ten in the world).
| 20km men | Asia | Europe | Africa | NACAC | CONSUDATLE |
| | | | | | |
| 2014 | 5 | 5 | - | - | - |
| 2015 | 8 | 2 | - | - | - |
| 2016 | 4 | 2 | 1 | 3 | - |
| 2017 | 5 | 3 | - | - | 2 |
| 2018 | 5 | 2 | 2 | - | 1 |
| Total in five years | 27 | 14 | 3 | 3 | 3 |
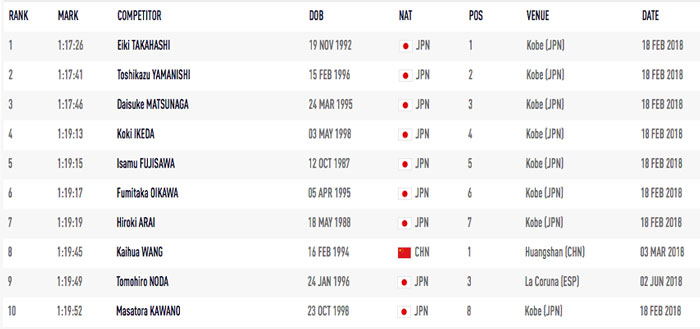
- It is even more impressive to note that at the level of Asia the ten athletes that form the average speed of 2018 (15,20km/hr) nine are coming from Japan, and that seven of these performances are obtained in the 20km of Kobe at the beginning of the season.
The last interesting consideration is to observe the golden year of the NACAC, 2016.
In that season, three athletes from Canada (Inaki Gomez, Benjamin Thorne and Evan Dunfee) and seven athletes from Mexico (Omar Pineda, Jesus Tadeo Vega, Ever Palma Olivares, Pedro Daniel Gomez, Julio Cesar Gomez, Julio Cesar Salazar, Jorge Alejandro Martinez Baez e Isaac Palma Olivares) with the clear goal of preparing the Olympic Games, obtained an average speed (measured on 10 athletes) equal to 15.14km/hr better than those of Asia (15.12km/hr) and Europe (14.98km/hr).
The negative spread was -0.03 compared to that of the 10 best athletes in the world.
Only Asia succeeded in doing better in 2015.
We leave our readers in the following link the consulation of the chart and the complete table of average speeds in the five-year period and the considerations they would like to make.